


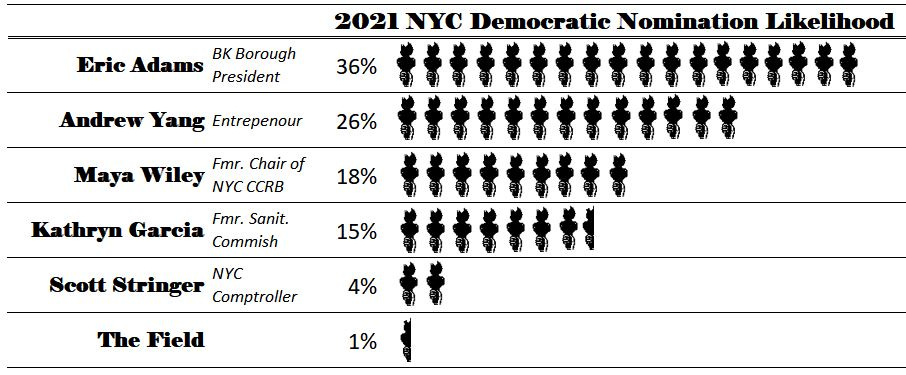
Below are the final MayorModel results for the 2021 Democratic Primary.
Go out and vote and be the data!
Here are my final observations before they begin to tally tonight.
Eric Adams is unsurprisingly the favorite. He has been leading most of the polls over the past few months by a small but significant margin.
Don’t discount Yang’s chances even though he lost some campaign steam after a strong initial showing. He was one of the first in-person campaigners among the field, and he gives a perspective outside of politics-as-usual in the city. This makes him the one candidate who can bring in the most new voters and really shake the polls.
Garcia will really be banking on the 2nd place votes. Teaming with Yang is a good strategic move since many of Yang’s votes would likely have gone to Adams. I wonder how many of his 2nd ranked votes she takes now.
The polls indicate Wiley has consolidated the progressive vote from Stringer and Morales. The key for Wiley will be to survive past Garcia in RCV. If she can make it that far, there is a good chance she will make at least top-2.
Now go out and vote!
Statistics 101
The basic premise of statistics is to make an inference of a population based on the characteristics of a sample. This is simple in theory, but difficult in practice, especially when it comes to polling.
I think it is a helpful exercise, even if it is obvious, to break down polling from a technical perspective.
The population we are interested in are people who will vote. It is not the total residents, all citizens, or all adults. This is simple but must be stated. The reason we need a sample is because we want to cheaply and quickly estimate how this population will vote.
In an ideal world, we would have a list of this population, and we could randomly select individual preferences. This is obviously impossible. Not only do we not know who is voting, but even if we had a list, it takes many missed calls (or rude hang ups) to get one data point.
In an opposite world, we have no idea what the population is like, and we can leave a poll open to have people choose to answer it. This again is not ideal. You can imagine the bias depending on where the poll is posted and who is sharing it. (See Twitter polls).
In reality, political polling is somewhere in between these two worlds. You hear the phrase “of likely voters”, and the key term is likely. We have enough data and tools to make a reasonably good guess as to who will vote. This does leave room for error.
Often people will ask “how can a sample of 1,000 predict a population of 10,000,000?” Sample size is the least of our worries with polling. There certainly is a chance we choose a terribly unrepresented sample, but if done well and randomly, pollsters will sample enough to fit within the stated margin of error. This margin acknowledges that there is a chance this sample’s estimate might not be correct, and that the true population average will fall within certain boundaries based on the sample’s estimate.
Another question people ask is “how can we only be using weights based off a few characteristics?” Again, this is not something we often have to worry about either. For example, Emerson mayor polling used gender, age, ethnicity, education, and region as weights. There are further ways to split the population, but the more splits means the costlier it becomes (i.e. more time and money spent on getting larger samples). These characteristics historically have done a adequate job of representing the population, but they are always a need of reevaluation.
The most important question you should ask goes back to the basic of statistics as stated above: does the sample represent the population? And as I stated above, we only can estimate “likely voters”. No, the sample does not represent the population. It rarely ever does, and it likely never will.
This does not mean you should disregard polls. Pollsters have well-informed ways of estimating how the part of the population which either are [1] not able to be contacted or [2] will not answer survey questions will vote based on past data and the data we can gather.
The assumptions input into these polls require thought, context, and testing, but these assumptions can also be easily manipulated. The quality of these assumptions are what separate the student from the master pollsters.
In a prior 2xParked, I broke down how to interpret polls. The key is to trust your source. I prefer polls from academic institutions (such as Siena, Marist, or Quinnipiac) because I can trust they use the best methodologies with the least incentive to be biased. The source alone can provide one with confidence of discriminating between the accurate from inaccurate, the precise from the imprecise, and the unbiased from the biased.
As the votes in the primaries are tallied today, do not be surprise when a candidate over- or underperforms. There is a 0% probability the polls will be correct, and that is ok. The hope is that pollsters learn, in a scientific way, how to improve for next time. I imagine with the introduction of RCV, there will be a lot of learnings to be had.
The one thing we can almost say for certain given the polls is that we will have to wait several weeks before declaring a winner. So go out and vote, and tell your friends to subscribe to 2xParked to read while we wait for them to count the results.
To subscribe to future newsletters, click here.
For more content, follow 2xParked on Twitter @2xParked.
Comments? Suggestions? Questions? Email me at 2xParked@gmail.com.