


NBC’s newest sitcom, Mr. Mayor, stars Ted Danson as the over-his-head surprisingly-competent mayor of Los Angeles. If you can wade through the abundance of zingers, you will find a show about a decent group of flawed individuals trying to impossibly push all the right levers of politics to make everyone happy. As you can imagine, the administration finds itself in some wacky situations.
The rumor is that instead of LA, the show was originally supposed to be a 30 Rock spinoff set in NYC. Although it is a shame we will not be seeing our city on the stream screen, the real life mayoral election has provided sufficient entertainment.
If you are not too burnt out from the news/elections/Twitter, we are going to have a little bit of fun thinking about data and the mayors of NYC.
The de Blasio Years
As our 109th mayor begins to send his resume out, I wanted to look back at his 7+ years as executive leader of our grand city.
What is best way to judge our mayor? There are a lot of things to consider, but given the nature of data availability and high correlations between variables, it was difficult to select just a few metrics.
I decided to use the Cobb-Douglas production function as my comparison base. This function is an economic model which takes a few inputs and relates it back to economic growth. Economic growth is highly correlated with many indicators of societal success, such as standard of living. In the Cobb-Douglas production function, there is usually an input of labor (L), the work force, and capital (K), value created.
Since we were limited by the data of the Federal Reserve of St. Louis, I used the unemployment rate to measure labor (L) and housing price index to represent value created (K). I contrasted our mayor, Bill de Blasio, to recent NYC mayors by comparing NYC performance in these metrics vs the national average.

Bill de Blasio has underperformed. A lot of this struggle, both labor and capital, are due to Covid, where the US is recovering much faster than the city. That means he still has time to lead a recovery of his legacy. Let’s hope he does.
The One Where We Became Mayor
Recently, we have seen New York celebrities run for elected office, using their name and brand to enter the conversation. This includes Donald Trump and Cynthia Nixon.
What if we went one step further than just selecting celebrities? What if instead, we had the fictional candidates run for office? How would they do in the election? I decided to take 9 different popular New York City fictional characters and input and impute their data into my MayorModel.
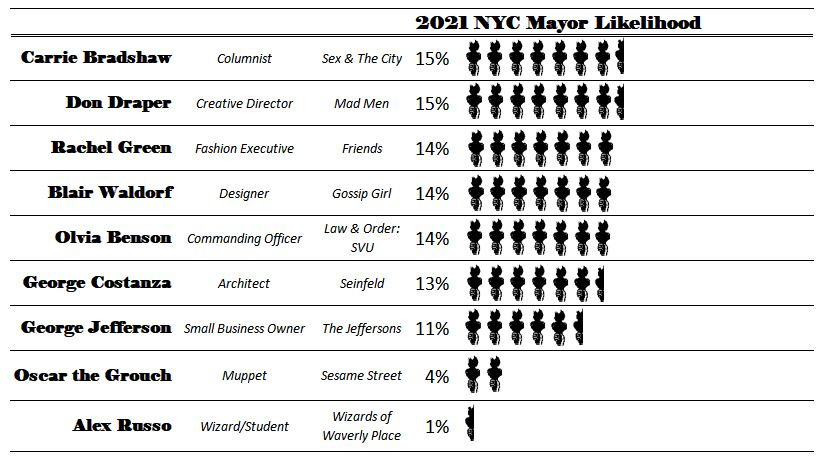
This would be a hell of a race. Imagine the storylines from any of these campaigns.
Real Mayor Data Reading
A few weeks ago, I emailed the mayoral field for recommendations on the data publications which inspired them. I got one response with a recommendation: Andrew Yang.
The Yang campaign recommended Raising the Floor: How a Universal Basic Income Can Renew Our Economy and Rebuild the American Dream. I have not read the book, but I appreciate the recommendation from the campaign. “I know that Andrew was inspired by ‘Raising the Floor’; which was written by the former head of one of the country's largest labor unions...It is full of great data and insight.”
MayorModel
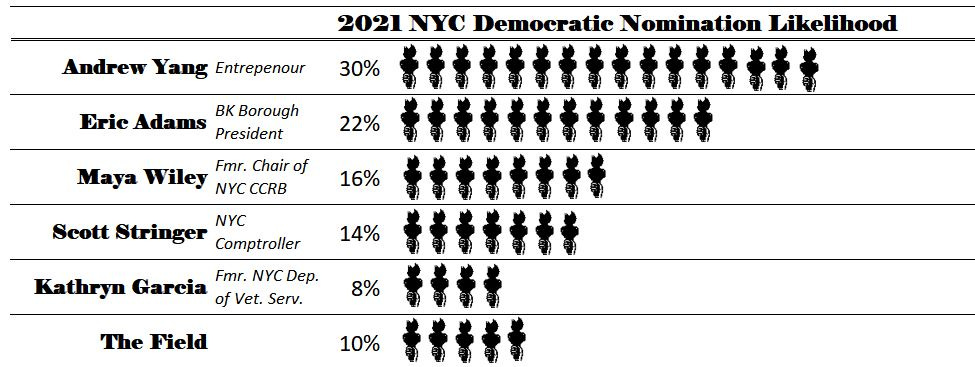
The first WPIX-TV/NewsNation/Emerson College poll has been released. Here are my three major takeaways:
This is great news for Yang. From my living room's view, his campaign appears to be relentless and non-stop (and it responds to my messages).
This is not promising for Stringer and Wiley. According to City & State Magazine, Wiley and Stringer are among the leaders in endorsements. They are not polling at 10% and have shown little separation from the other candidates. What other moves are up their sleeves?
17% “don’t know/other” is still uncertain. Assuming some of these candidates drop out, there is potentially 25% of the vote left. It is better to be in the lead than to not be, but the campaign is far from over.
Here are three questions I ask whenever I look at and use poll results.
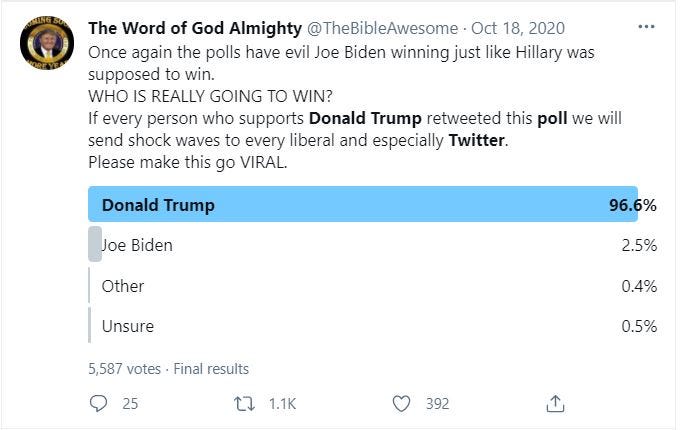
What is the source? We want the source to be unbiased and use the best methodologies. A good source will provide us trust in the sample size, stratification methods, and sampling methods. If I see a university (e.g. Emerson) or a broadcast network (e.g. CBS), I am more more likely to trust the source. Since this mayor poll is done by Emerson, it is likely can be trusted as a good poll. Here are some recent examples of bad sources:

A MAGA supporting profile poll is likely to skew in favor of DJT. 
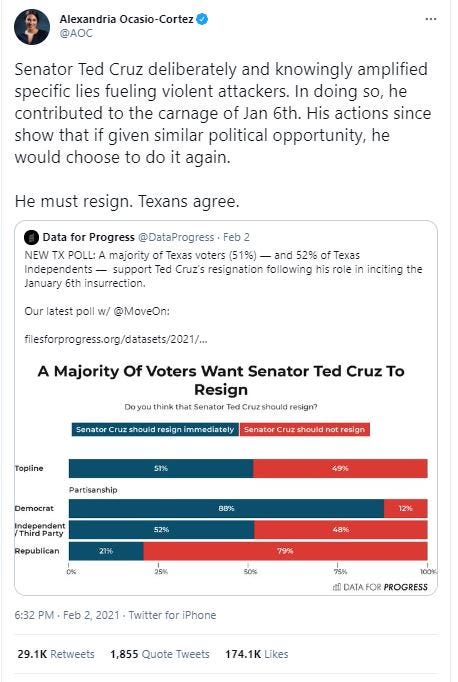
Rep. Ocasio-Cortez is quoting Data for Progress, a progressive think tank. Poll results will likely bias towards progressive sentiment. How close is the leader near the target score? For some elections, the leader has to be above 50%. For other elections, the leader has to be in first place. The real margin of error is usually larger than what is presented. I usually feel confident if I see polling 1-2x margins above the threshold. In this poll, Yang clearly has a lead, but he is still far from where he needs to be. Even with the second place votes, his campaign would be a lot more comfortable if he were polling at 45%.
How much is uncertain? At face value, "don't know" represents true uncertainty, but that is not always the case. You have to add context. For example, polling is over "likely voters", and there is often a high correlation between uncertainty in candidate choice and uncertainty in likely to vote. The mayor election is still not top of mind for all New Yorkers, but with a reduction from near 30% uncertainty a month ago, it slowly is becoming part of our conversation.

"Polling" was drawn by Ink&thyme, drawing life's unforgettable moments. For unique art drawn just for you, check them out on Facebook and on Instagram.
To subscribe to future newsletters, click here.
For more content, follow 2xParked on Twitter @2xParked.
Comments? Suggestions? Questions? Email me at 2xParked@gmail.com.