2xParked #64
Buzzer Beater

Despite last night’s loss, there is still a buzz outside that is the loudest in my 16 years of living in New York City. Even if the president’s visit stopped fans from loitering around MSG or you decided to watch from the comfort of your living room, you can’t escape it.
In a city starving for a championship, the Knicks might represent the worst of our sports famine. The Jets have a longer drought, but the Jets have also been mostly pathetic for the greater part of the last 50 years. Meanwhile, the Islanders are back on Long Island, the Mets put on a better show because they don’t win, and the Rangers/Yankees/Giants have at least won something since the 90s.
The Knicks have had their fair share of Jets-like years, but they have bordered greatness too. Since 1973, they have made two finals, nearly broke up the first Jordan three-peat, and were valiantly eliminated at the finish line in multiple classic series against rivals like the Heat or the Pacers. Even at their worst, the ticket prices for nosebleeds could cover the medical costs for an ER visit for nosebleeds, and they were still sold out.
When the team began their run a few seasons ago, you could feel the simmer. Now that they have made it this far, the screams of “Go Knicks” start the moment you walk out for the subway on your morning commute and end well beyond your bedtime.
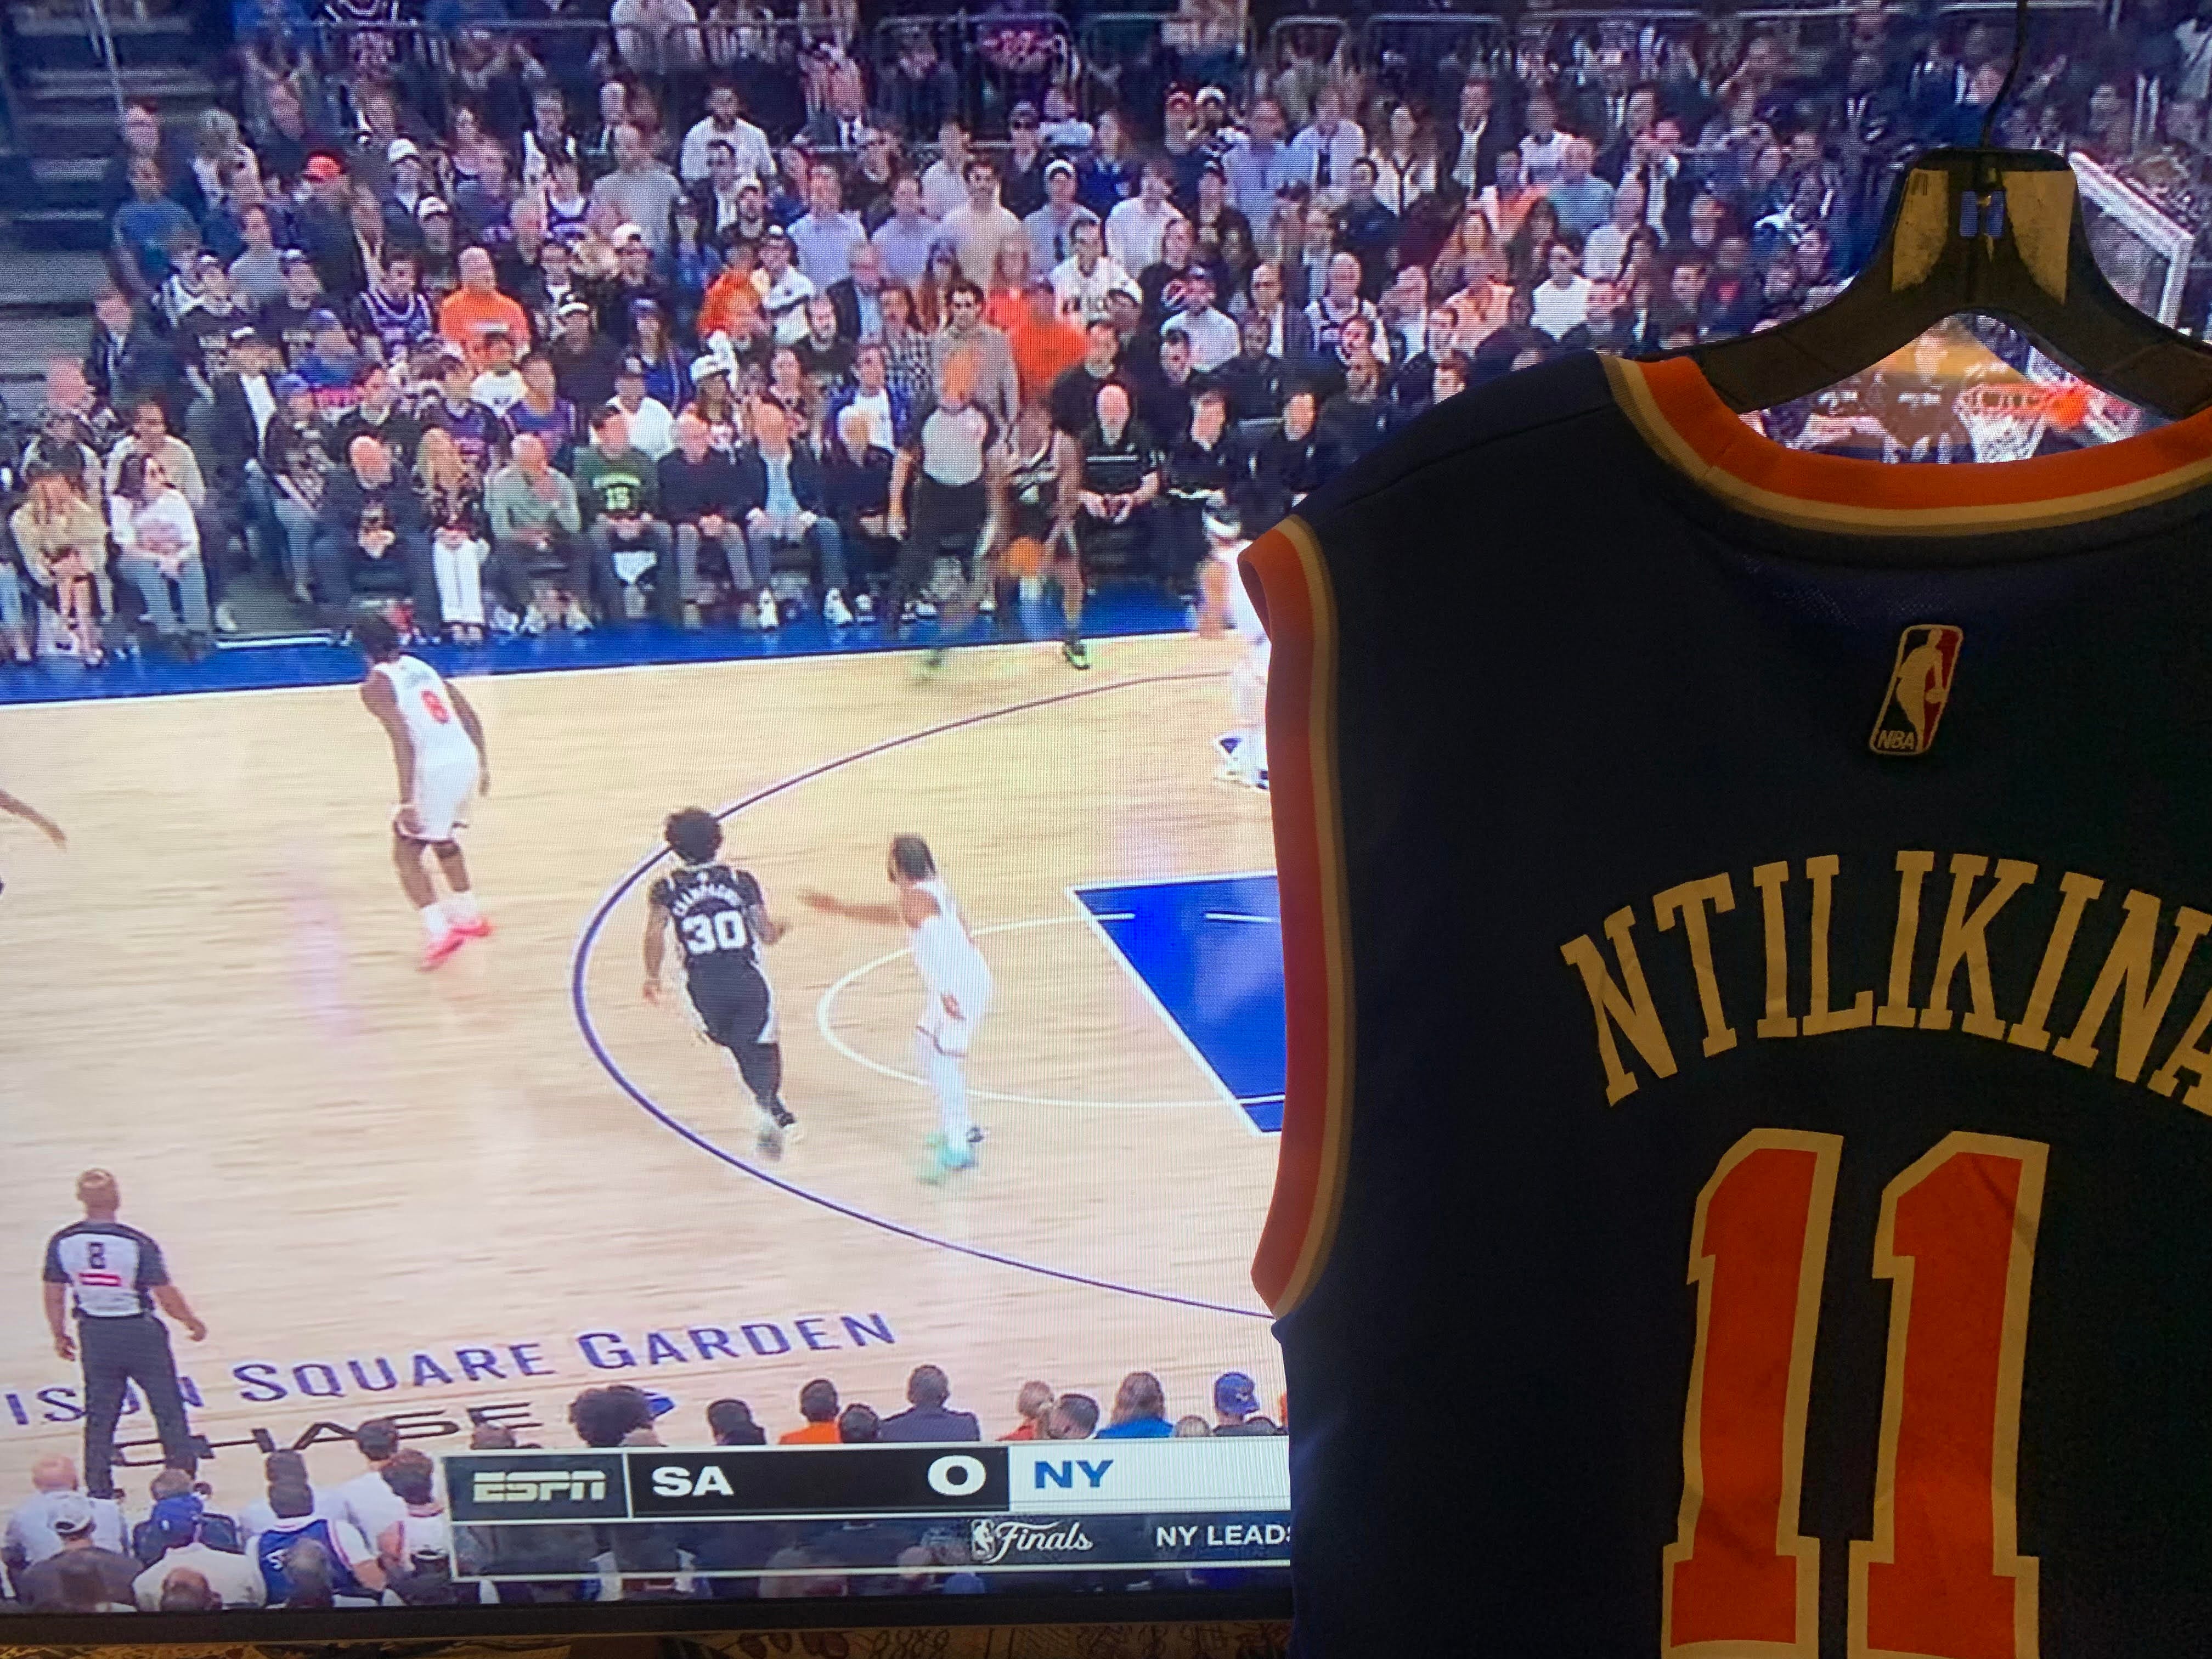
The Knicks might not be the most popular team in the City, but are they truly the buzziest team in NYC? Or is this just anecdotal evidence and/or recency bias speaking loudly as they often do?
We have some fun1 data to look at, so let’s take a quick unscientific investigation! Yahoo!
Looking at NYC OpenData, we can use a literal measurement for “buzz.” We can count the number of 311 noise complaints reported.
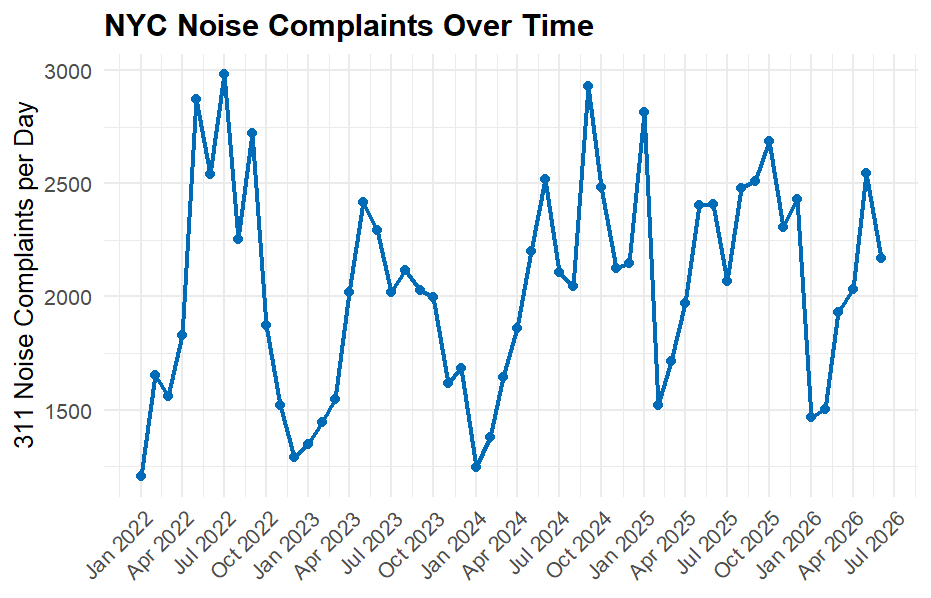
We can see there is seasonality, with more noise complaints correlated with summer, likely when more people are out on the streets. I will use average temperature as a proxy to reduce this seasonal impact.
As a measure of interest in a team, Google Search Index for searches in the New York, NY area is a good proxy as well.
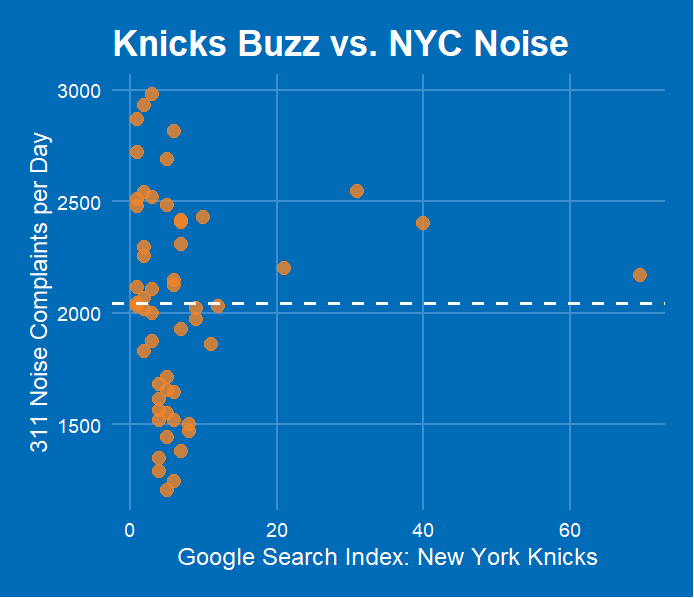
Even if I go back to January 1, 2022, this does not leave us a whole lot of data points2 to play with3. This means narrowing down which NYC teams to include, so I set some strict criteria:
New Yorkers must feel the teams are “New York City” teams: Teams must be considered NYC teams, even if they play in New Jersey. This eliminates the Devils, but not the Jets, Giants, or Red Bulls.
There must be a reason at some point during the data set for buzz about the team: Teams must have won at least one playoff series during this time period to give fans a real sense a real chance of winning it all. I don’t want to extrapolate. Sorry, Nets, Jets, and Islanders.
Teams must be universally popular: Teams must play in a league where the average finals TV rating exceeds 10 million viewers. This excludes the Liberty, NYFC, the Red Bulls, and all other professional teams.
This leaves the Knicks, Mets, Yankees, Giants, and Rangers.
I regressed number of 311 noise complaints by temperature and Google search index by team. This is what the coefficients looked like for the teams:
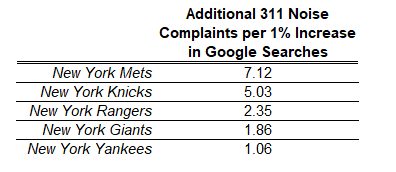
This means for every point increase in Google Search Index for each team, we expect this (the coefficient) many more 311 noise complaints in a given day. From this perspective, the Knicks come in as the second buzziest team in New York, right after the Mets. Maybe there is something to the blue and orange. Also LET’S GO METS!
I know Knicks fans are probably a bit cranky after last night, so before all you Knicks fans get angry with me, I must be honest: this model sucks. It really sucks. What is worse is that these are often the types of results which get published in non-peer reviewed articles as fact. Perhaps understanding why this model is bad is the learning moment to be aware of other bad linear regressions?
The variances for these coefficients are very high. This means that we have very little precision for these estimates. I excluded it for a reason to prove a point. Statistically, the variances are so high that we can’t even definitively feel confident the Knicks are buzzier than the Yankees in this model.
It is only a correlative study and not a causal study. It would have been amazing if we had the multi-verse where the only difference was the Google Searches. Maybe we do have multi-verses, but we sure don’t have that data.
I excluded a lot of potential variables which might actually be causal reasons which explain, or confound, the 311 complaints. I accounted for a big one (temperature explains 15% of the variance), but I am sure you are already thinking of 5 other things not considered.
There are also other statistical reasons why this model is bad.
Funny enough, though, if you asked me at the beginning of the article what the general order of these teams would be, the results are close to how my thumb is on the pulse. Maybe I should have done a Bayesian model with my gut as a prior? Eh, I think we reached our stats quota for one day. We are all tired this morning after watching last night’s game.
Either way, this does not mean we should not enjoy our team’s success. Just try and not to annoy the neighbors too much when you do.
Until next time,
Adam from 2xParked
I know linear regressions are your form of fun too.
Especially since Google Search Index is measured monthly and only runs through the end of May from this perspective.
I wanted to exclude the slow ramp up post-covid to hanging in bars.